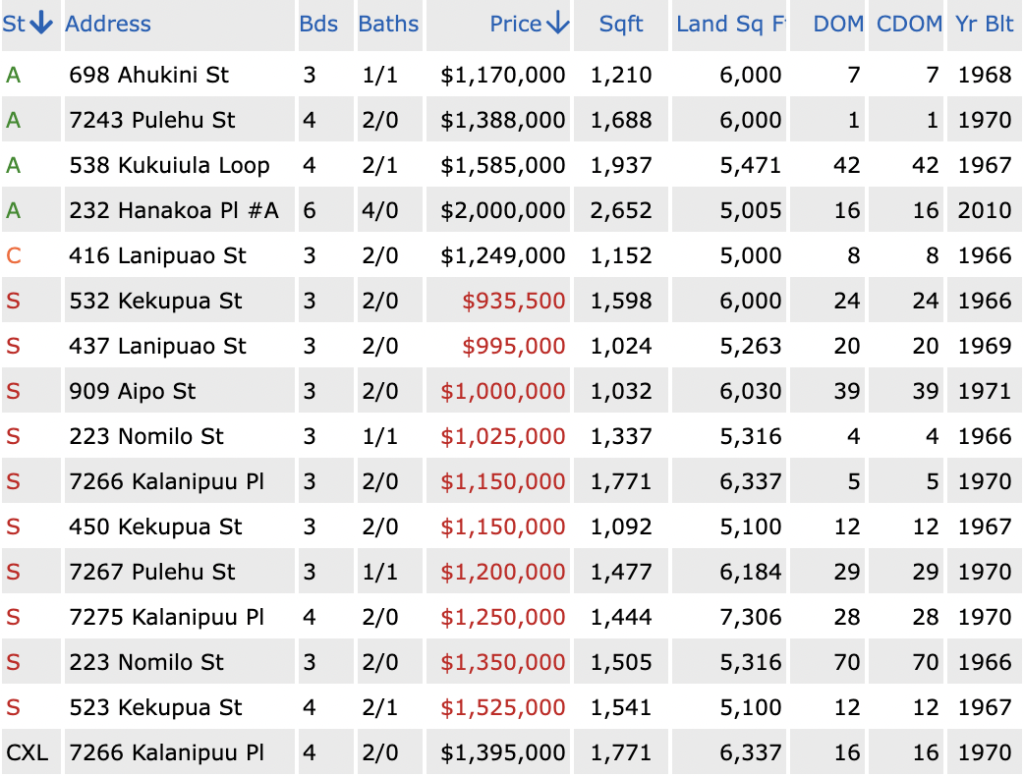
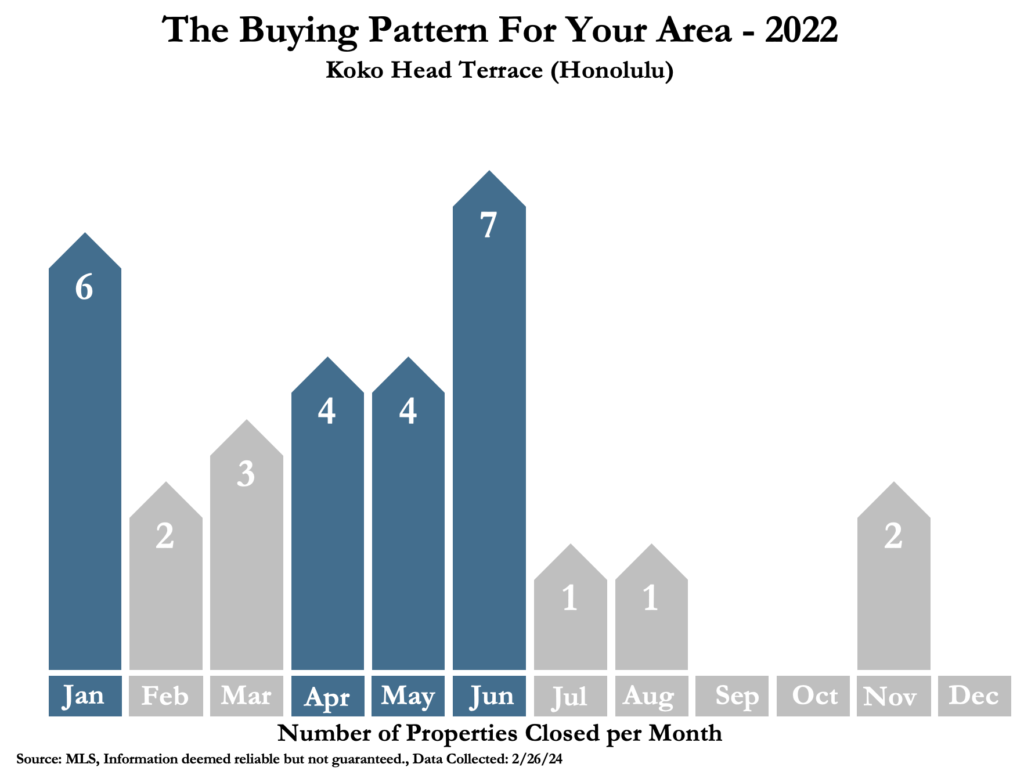
In this chart, we can see the “Odds of Selling Your Home”. It is based on the last 2 years of sales in Koko Head Terrace. We can see that in 2022, 30 homes sold (blue), 3 were for sale at the end of the year (green) and 5 did not sell(red). Homes were selling at a rate of about 2.5 per month and there was 1.2 months of inventory on the market. This means if no new homes came on the market, there would be nothing for sale in 1.2 months. 6 months is considered a “balanced market.” So, 1.2 months of supply is ridiculously low and represents a “seller’s market.” Homeowners had a 79% odds of selling in 2022.
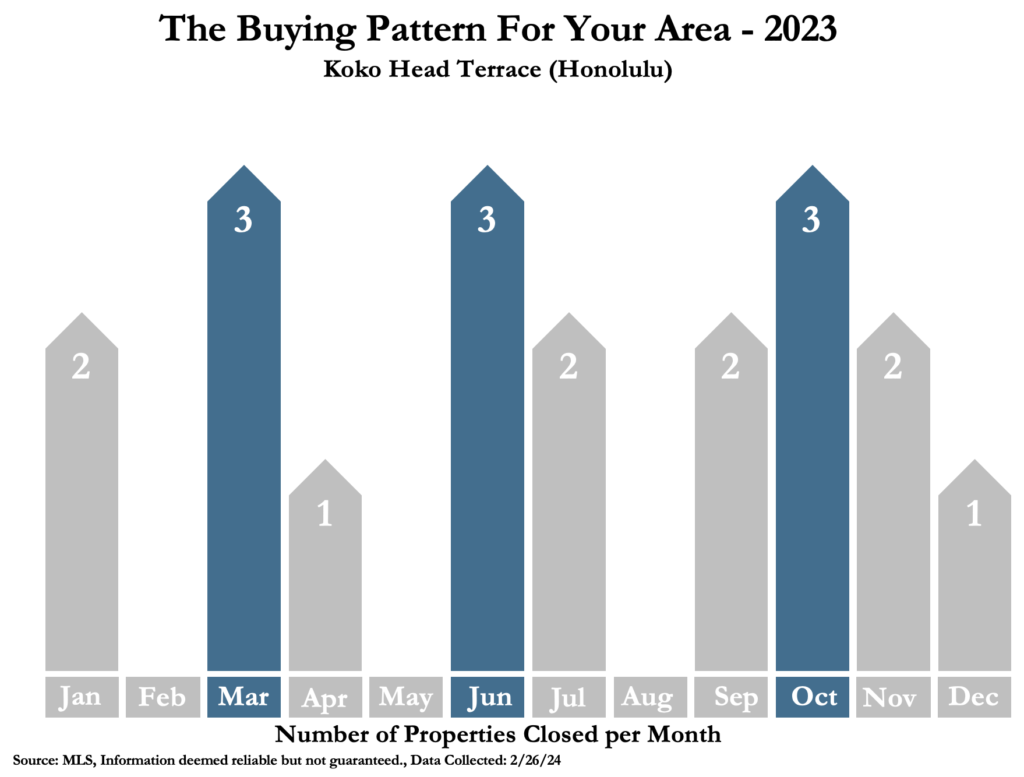
If we take a look at 2023, we can see that only 19 homes sold (down 37%) to a rate of 1.6 per month. This decrease in homes sold was indicative of the broader market in 2023. Home sales/closings were down 50%, island wide. Caused by interest rates doubling since January 2021. Now in 2024, interest rates are around 7%, which is a point shy of tripling in 3 years. In 2023, the inventory was still extremely low at 1.3 months of supply. Only 1 property did not sell in 2023. Seller’s have an 86% odds of selling in 2023 (up 9%).
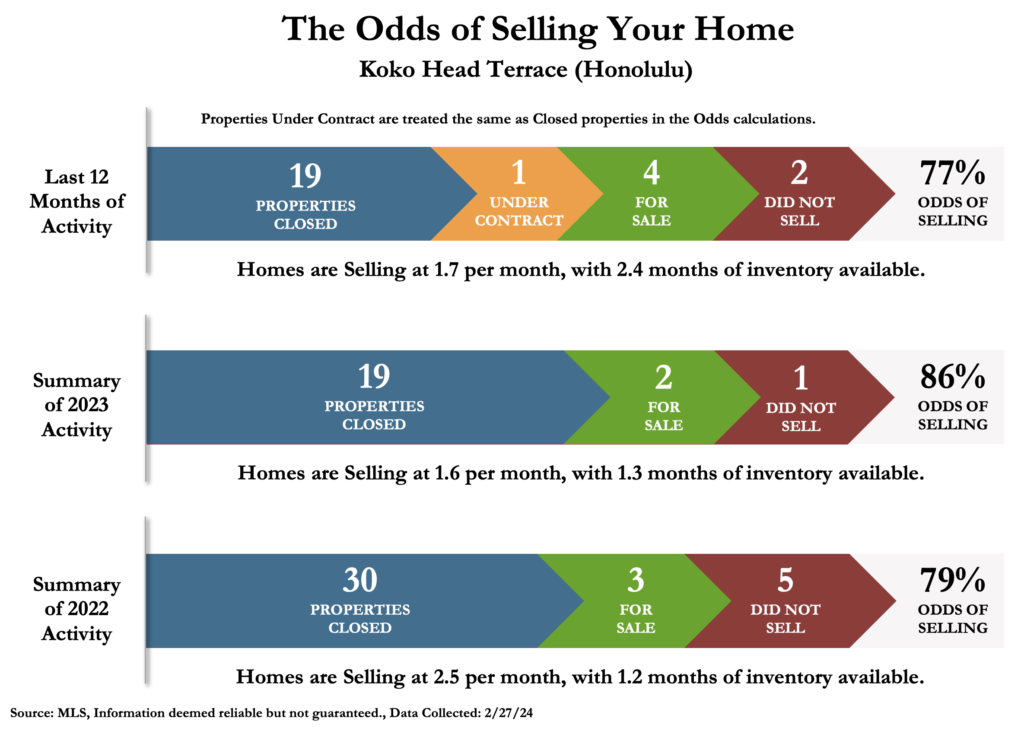
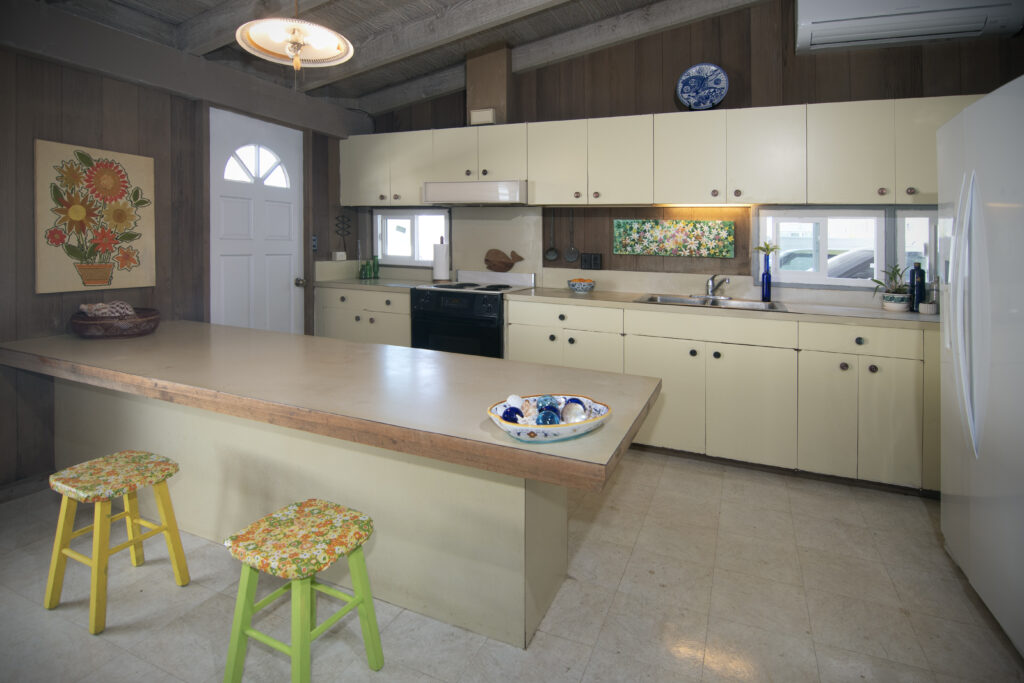
In 2022, it took 57 days, on average, or 29% longer to sell a home in Koko Head Terrace. Average sales price in Koko Head Terrace is just over $1.4M.